Posts from LinkedIn and X, newest first: data viz, research, launches and a podcast shout-out.
No posts match these filters.
LinkedIn·
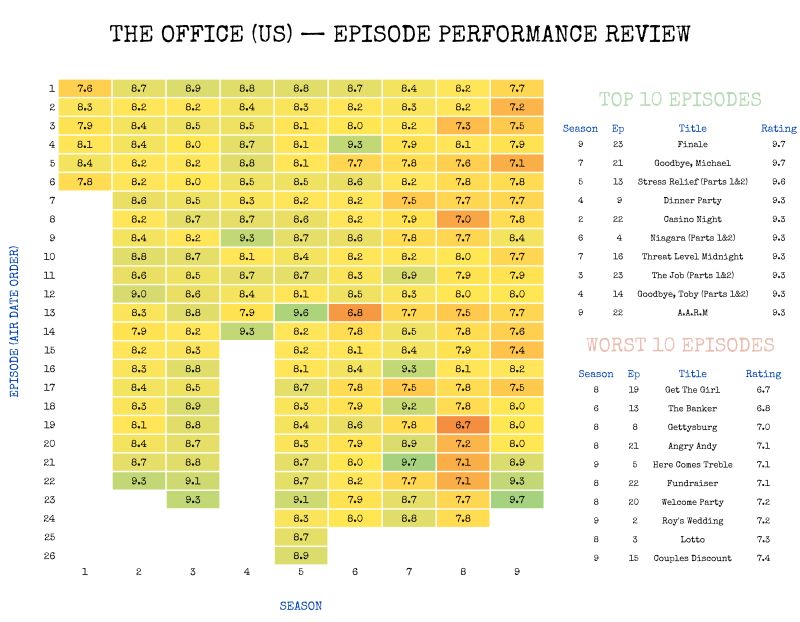
The Office, episode by episode: what happened after Season 7?
Not sure why I’ve made so many heatmaps over the years but never thought of applying one to my all-time favorite TV show: The Office 📎
Slow Saturday morning = coffee ☕ + R 💻 + Positron ⚡ + IMDb data 🎬
I do wonder what happened after Season 7 though... 😄📉
Any clues Varsha Negi Aswin Saravanan? Peak era memories right there!
#rstats #positron #theoffice #IMDb
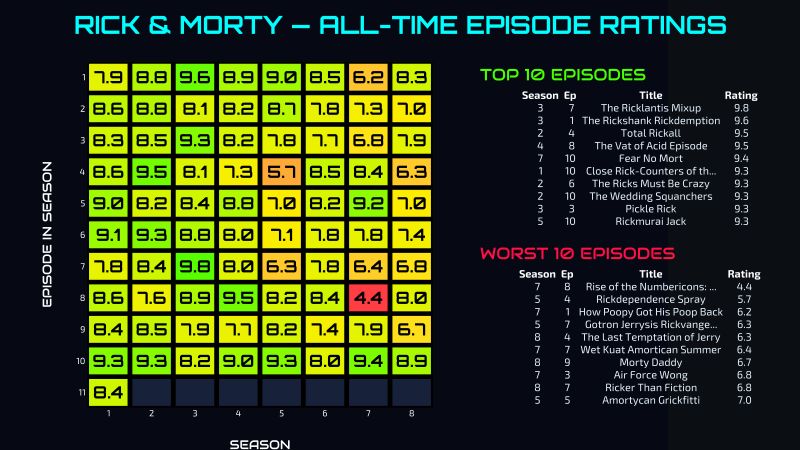
Rick and Morty, rated: a neon heatmap of every episode
🧪 “Come on, Morty! It’ll be a quick, 20-minute adventure...” 🧪
Shoutout to Andrei Zimin, always pushing me to go a bit further. This time he asked if I could try my Simpsons-style heatmap on Rick & Morty.
And since I try to give the people what the people want... I went for it.
1️⃣ Built the visualization in Positron 🔬
2️⃣ Data scraped from IMDb 💾
3️⃣ Combined a neon heatmap + Top 10 & Worst 10 episodes table ⚗️
A fun little experiment mixing data wrangling, design, and fandom.
Curious which show deserves the next heatmap treatment? ♨️
Better Call Bayes: was Suárez really La Liga's most clinical finisher?
BETTER CALL BAYES ☎
Let’s rewind to La Liga 2015/16. What a season it was. Messi, Suarez, and Neymar (MSN) led Barcelona to its 24th title, clinching 91 points, edging out Real Madrid (90) and Atletico Madrid (88).
That title bore Suarez’s indelible mark. He emerged as the top scorer ('el pichichi') with 40 goals, outpacing Cristiano Ronaldo by 5. Suarez was in his prime, exhibiting extraordinary effectiveness: 40 goals from just 139 shots, compared to Cristiano's 228. That's a 28.8% scoring ratio for arguably the greatest Uruguayan player of all time.
28.8%. Astonishingly surgical precision. But wait! Imagine you were watching the season highlights on TV and a table pops up showing the "Top 5 Highest Goal Scoring Accuracy, La Liga 2015/16". This is what you'd see:
1. Imanol Agirretxe
2. Luis Suarez
3. Carlos Castro
4. Víctor Casadesús
5. Cédric Bakambu
Does this mean Suarez, with 40 goals from 139 shots, was actually second in accuracy? Was Imanol Agirretxe more clinical? Well, he scored 27 fewer goals than Luis. That should count for something, right?
Enter Empirical Bayes. I discovered Empirical Bayes estimation through the work of the GOAT, David Robinson. He has a beautifully crafted article on his blog: https://lnkd.in/dhwfejm6
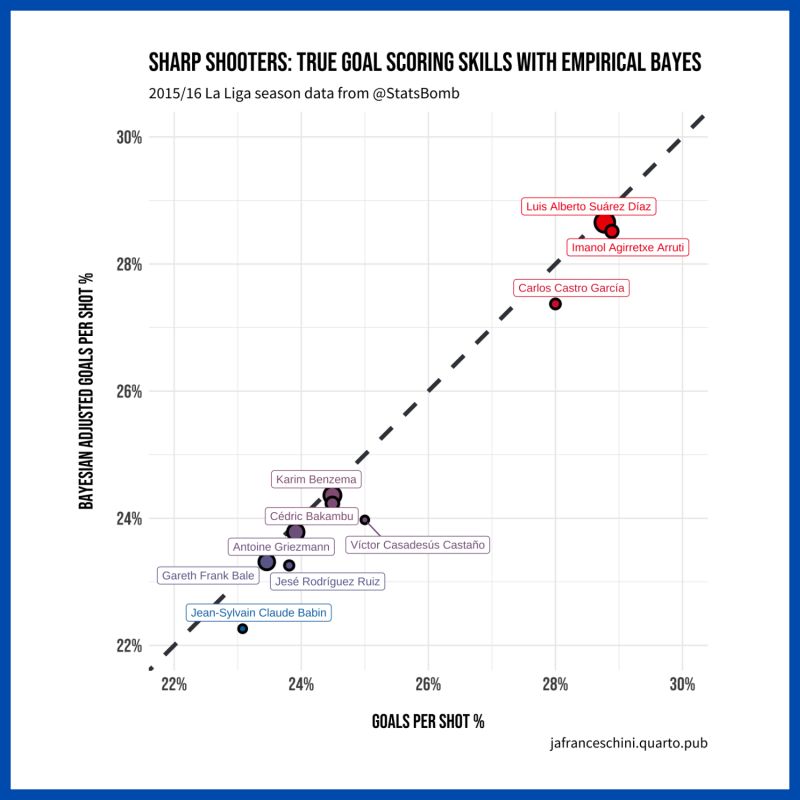
In scenarios where "proportion of success" is tied to low counts (like shots in this La Liga example), Empirical Bayes offers a method to learn a prior probability distribution from the data itself and then compute posterior probabilities that “shrink” the proportion for those with lower counts.
Empirical Bayes in action is illustrated in the chart below. Players with fewer shots (like Agirretxe) are adjusted towards the mean of the prior, while high-volume shooters (like Luis Suarez) retain most of their original accuracy.
Now, what if the table read, “Empirical Bayes Adjusted Top 5 Highest Goal Scoring Accuracy, La Liga 2015/16”? The results would be:
1. Luis Suarez
2. Imanol Agirretxe
3. Carlos Castro
4. Karim Benzema (who wasn’t in the top 5 before!)
5. Cédric Bakambu
Sorry, Víctor Casadesús, but with only 12 shots, your Bayesian adjusted ratio drops you out of the top 5. You got shrunk!
This analysis was a blast. We're not only recognizing Suarez as the top scorer but now also as the most accurate. Truly a season for the ages.
Looking for more? Check out projects like this on my website: https://lnkd.in/e3CvxiAH
A huge shoutout to StatsBomb for their publicly available data. Their contributions to the analytics community are invaluable and deserve a shoutout: https://lnkd.in/dwNE_ieM
🚀 LAUNCH ANNOUNCEMENT! A couple of months ago, I started a weekend project exploring text embeddings and pair programming with ChatGPT. The outcome? A movie recommendation system, which was initially intended to be just a fun tool to run locally on my computer and share with friends (shoutout to my cousin Guzman Andreatta). That project evolved, and today, I'm happy to introduce "Plot Twist: A New Way to Discover Movies” to all of you. Access here: https://lnkd.in/eSCta4Au
🎬 Plot Twist takes a unique approach. Instead of focusing on genres or user ratings, it delves into the heart of movie narratives. Utilizing AI embeddings, it analyzes extensive plot summaries (600 words or longer) to unearth hidden connections between films, providing a fresh perspective for movie discovery. It taps into a database of 1,000 movies from the CMU Movie Summary Corpus and offers a list of movies with similar plotlines to your chosen film, complete with similarity scores (0-100%) and worldwide box office data (small, independent film or huge blockbuster?).
💡 The journey of developing Plot Twist has been lovely. It offered a firsthand glimpse into the productivity potential that large language models and AI tools provide. A project of this scope would have absolutely taken me months to complete, but now with ChatGPT's help, I managed to go from ideation to launch during a handful of Friday coding nights – believe me, as a father of 2 there is not a lot of time to spare lately!
✨ TRY IT OUT! If you're looking for a 'plot twist' in your movie nights, give it a shot. I'd love to hear your feedback, so please don't hesitate to reach out and share your thoughts. Also, what do you think of the logo? Spoiler alert: it’s AI-generated too! Midjourney created this beautiful design, which would have been beyond my reach given my very limited art skills.
Here's to uncovering new stories! 🥂
#embeddings #OpenAI #movierecommendations #PlotTwist
An evolutionary-biology framework for TV catalogs, with Parrot Analytics
I'm so happy this is finally out! It's the result of a lot of hard work behind the scenes. Professor Gregory LaBlanc's multidisciplinary teaching philosophy was the main source of inspiration. This time, Daniel Quinaud and I took cues from evolutionary biology to reimagine how audiences interact with shows from different catalogs. We propose a framework that disrupts equilibrium conditions in TV consumption and creates incentives to optimize long-term engagement. The toughest part was packaging this into a practical, compelling toolset to help creators and streaming platforms manage their portfolios more effectively. That's when the one and only Brandon Katz stepped up and wrote a must-read article that you can access below 👇. I hope you all can spare just 10 minutes of your day to dig into this engaging piece. Exciting times lie ahead at Parrot Analytics! 🚀
34 seasons, 745 episodes of #TheSimpsons summarized in one chart. The 'Golden Age' REALLY happened and it looks... short? 🤔
Data comes from IMDb.com. Applied a rolling average to smooth out the series. Green = higher IMDb ratings, Red = lower IMDb ratings.
Inspiration came from this lovely tutorial: https://lnkd.in/eF972Hw9
#rstats
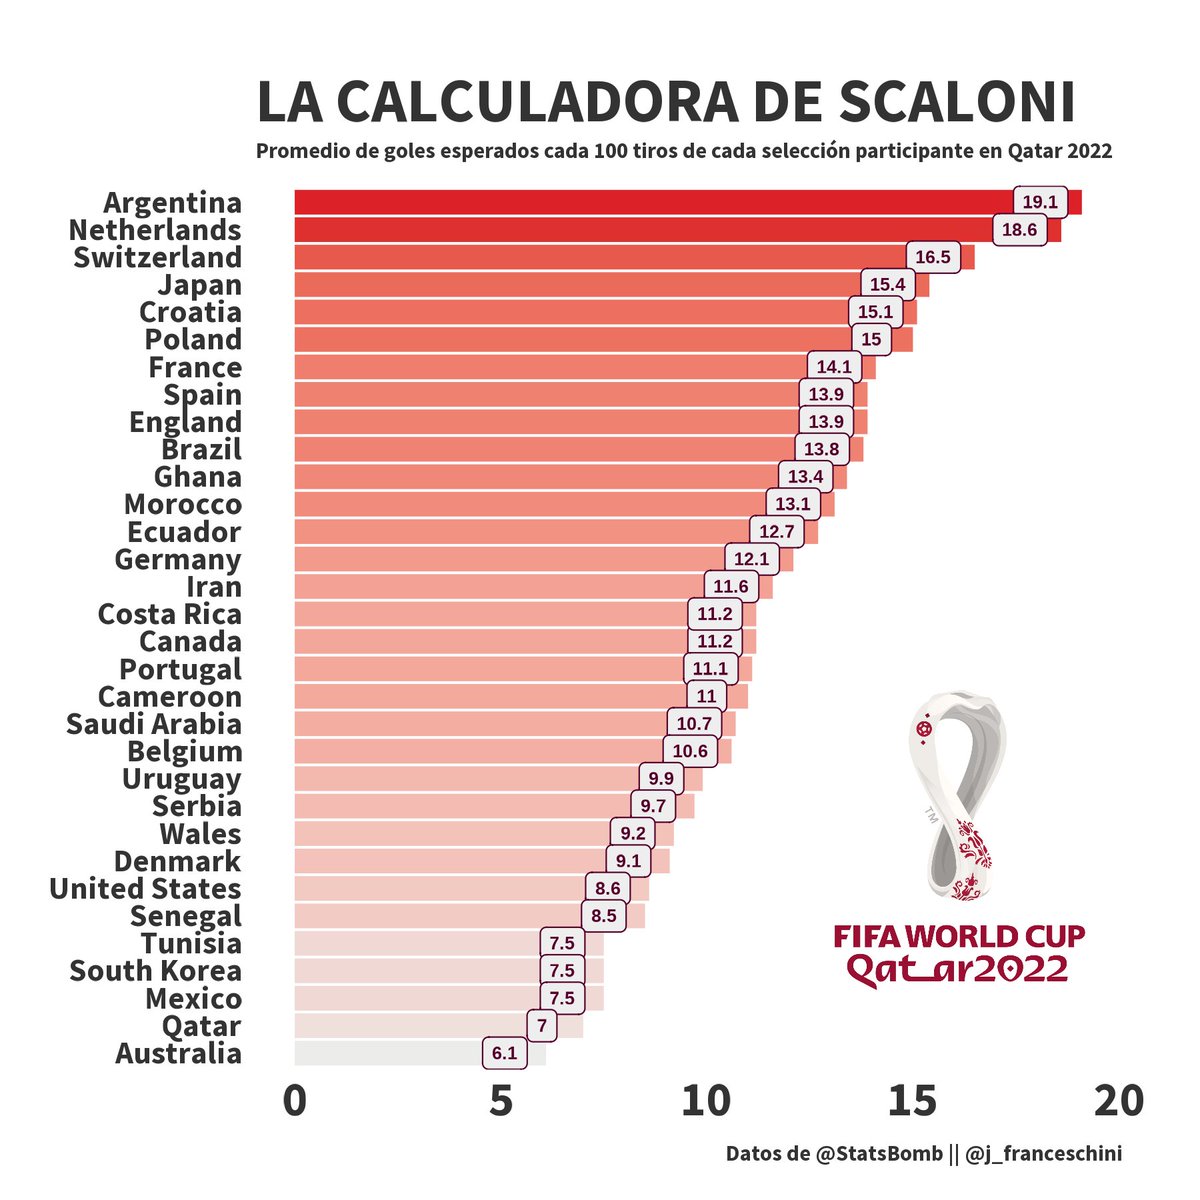
El otro día conversando con @giambrunofede buscabamos un paralelo en el fútbol de la tendencia en el basket de la NBA de enfocar el ataque en tiros eficientes. Acá va mi intento como para abrir el debate.
@afa: el equipo más "quirúrgico" en #Qatar2022.
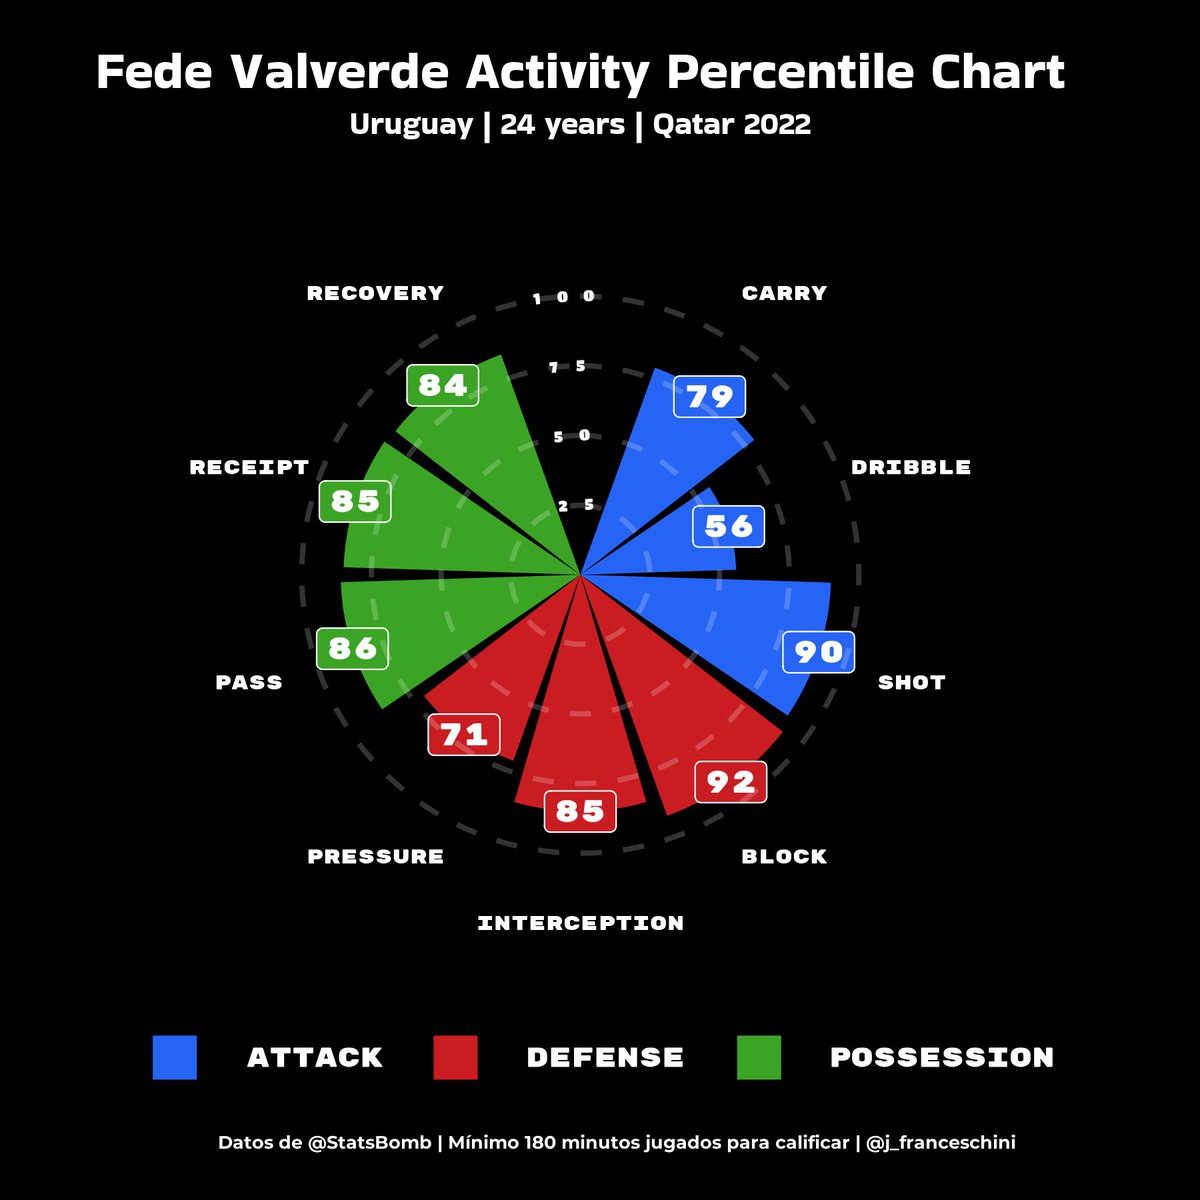
EN DEFENSA DEL HALCÓN 🦅
En otra entrega de análisis de datos del mundial #Qatar2022 que publicó @StatsBombES usando #rstats, me atrevo a quebrar una lanza por el halcón @fedeevalverde que fue uno de los más apuntados por la eliminación temprana de Uruguay. Qué dice la data? 🎲
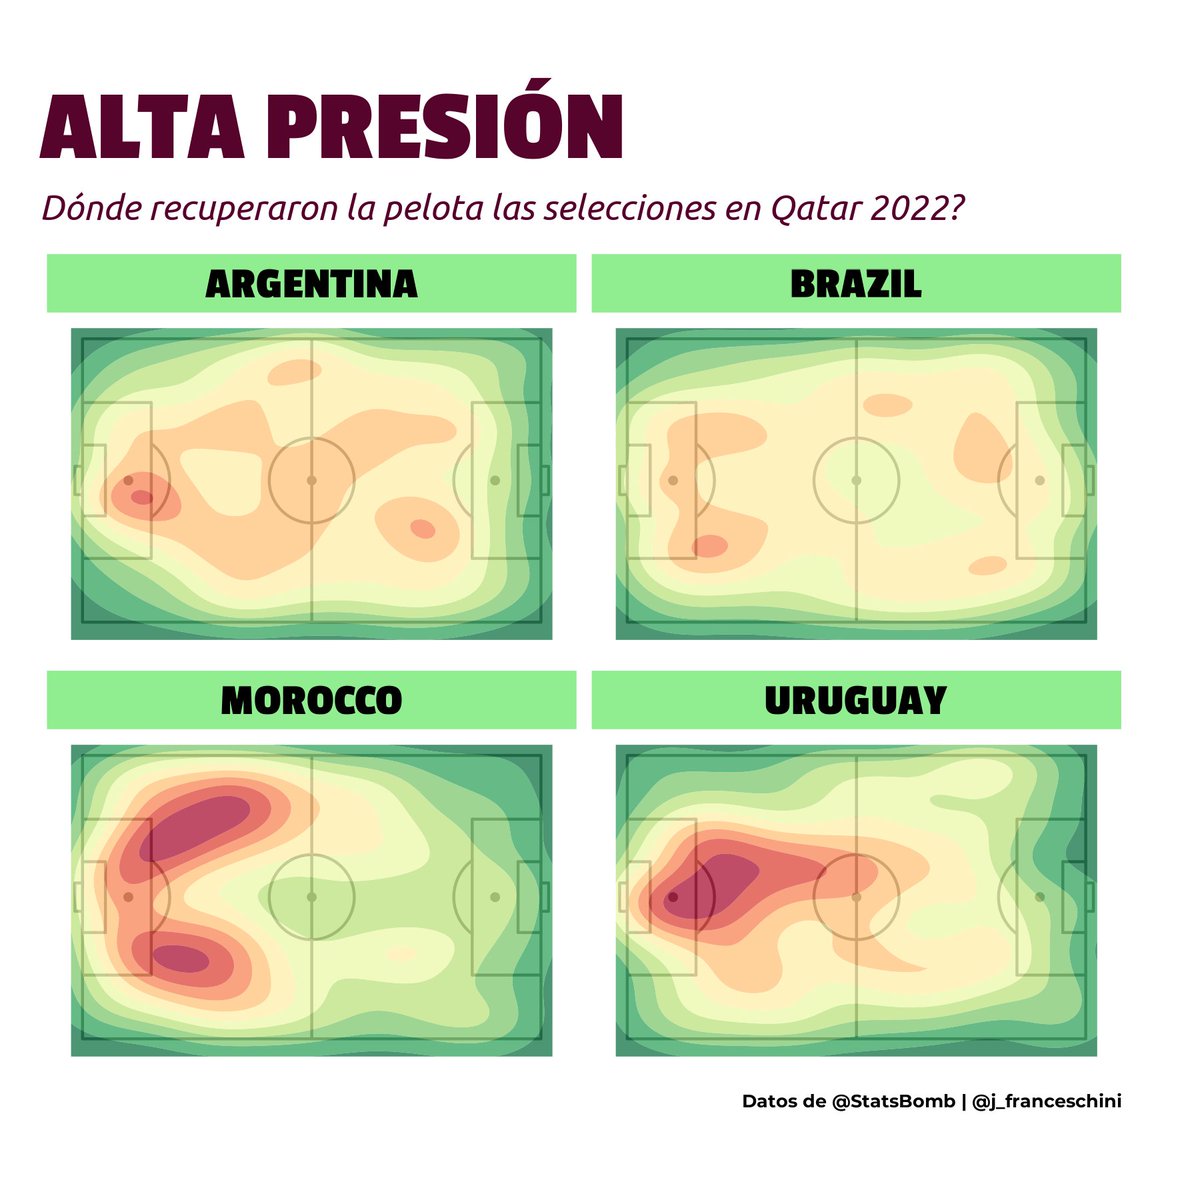
Sigo fascinado por la data pública del mundial 2022 que publicó @StatsBombES.
Algo que nunca había hecho antes fue recrear mapas de calor, y me generó curiosidad entender en qué zonas las selecciones recuperaron la pelota. Elegí ejemplos que contrastan para compartir (1/3)
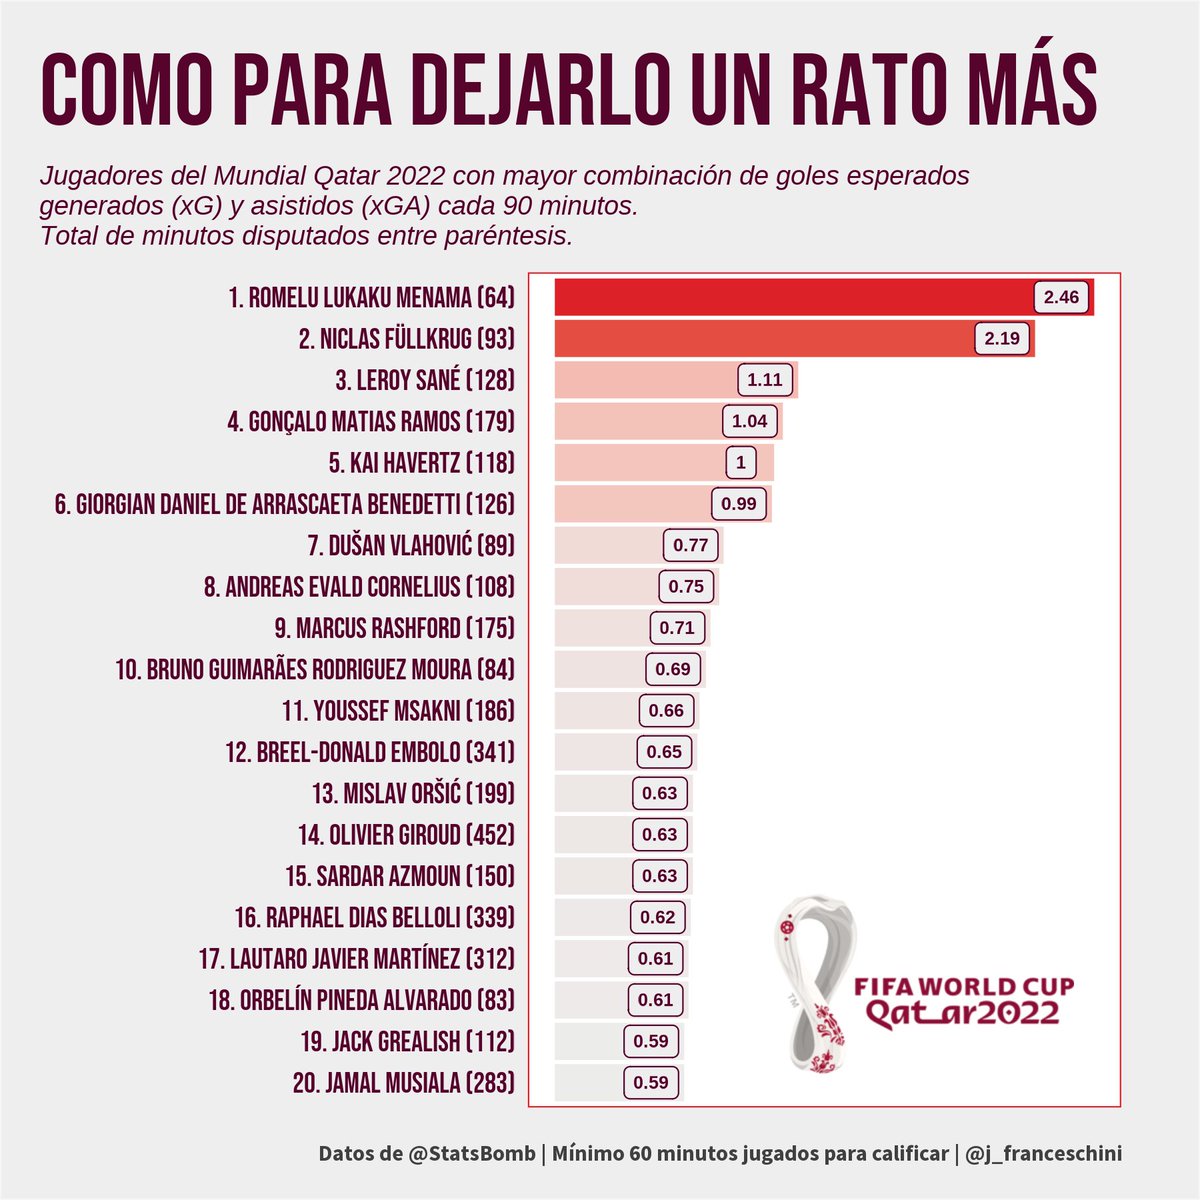
@StatsBomb publicó gratuitamente su data del mundial #Qatar2022 y es un viaje. Se pueden armar un montón de cosas interesantes pero como para arrancar quise profundizar en el GiorgianDeArrascaeta-gate. Cierran los números? 🧮